Three documented case studies translated into the metrics that matter: revenue, conversion efficiency and purchase volume. The original reporting is shown alongside the numerical story and the operating decisions behind it.
01E-commerce / Revenue
Google Shopping + Meta
Outcome
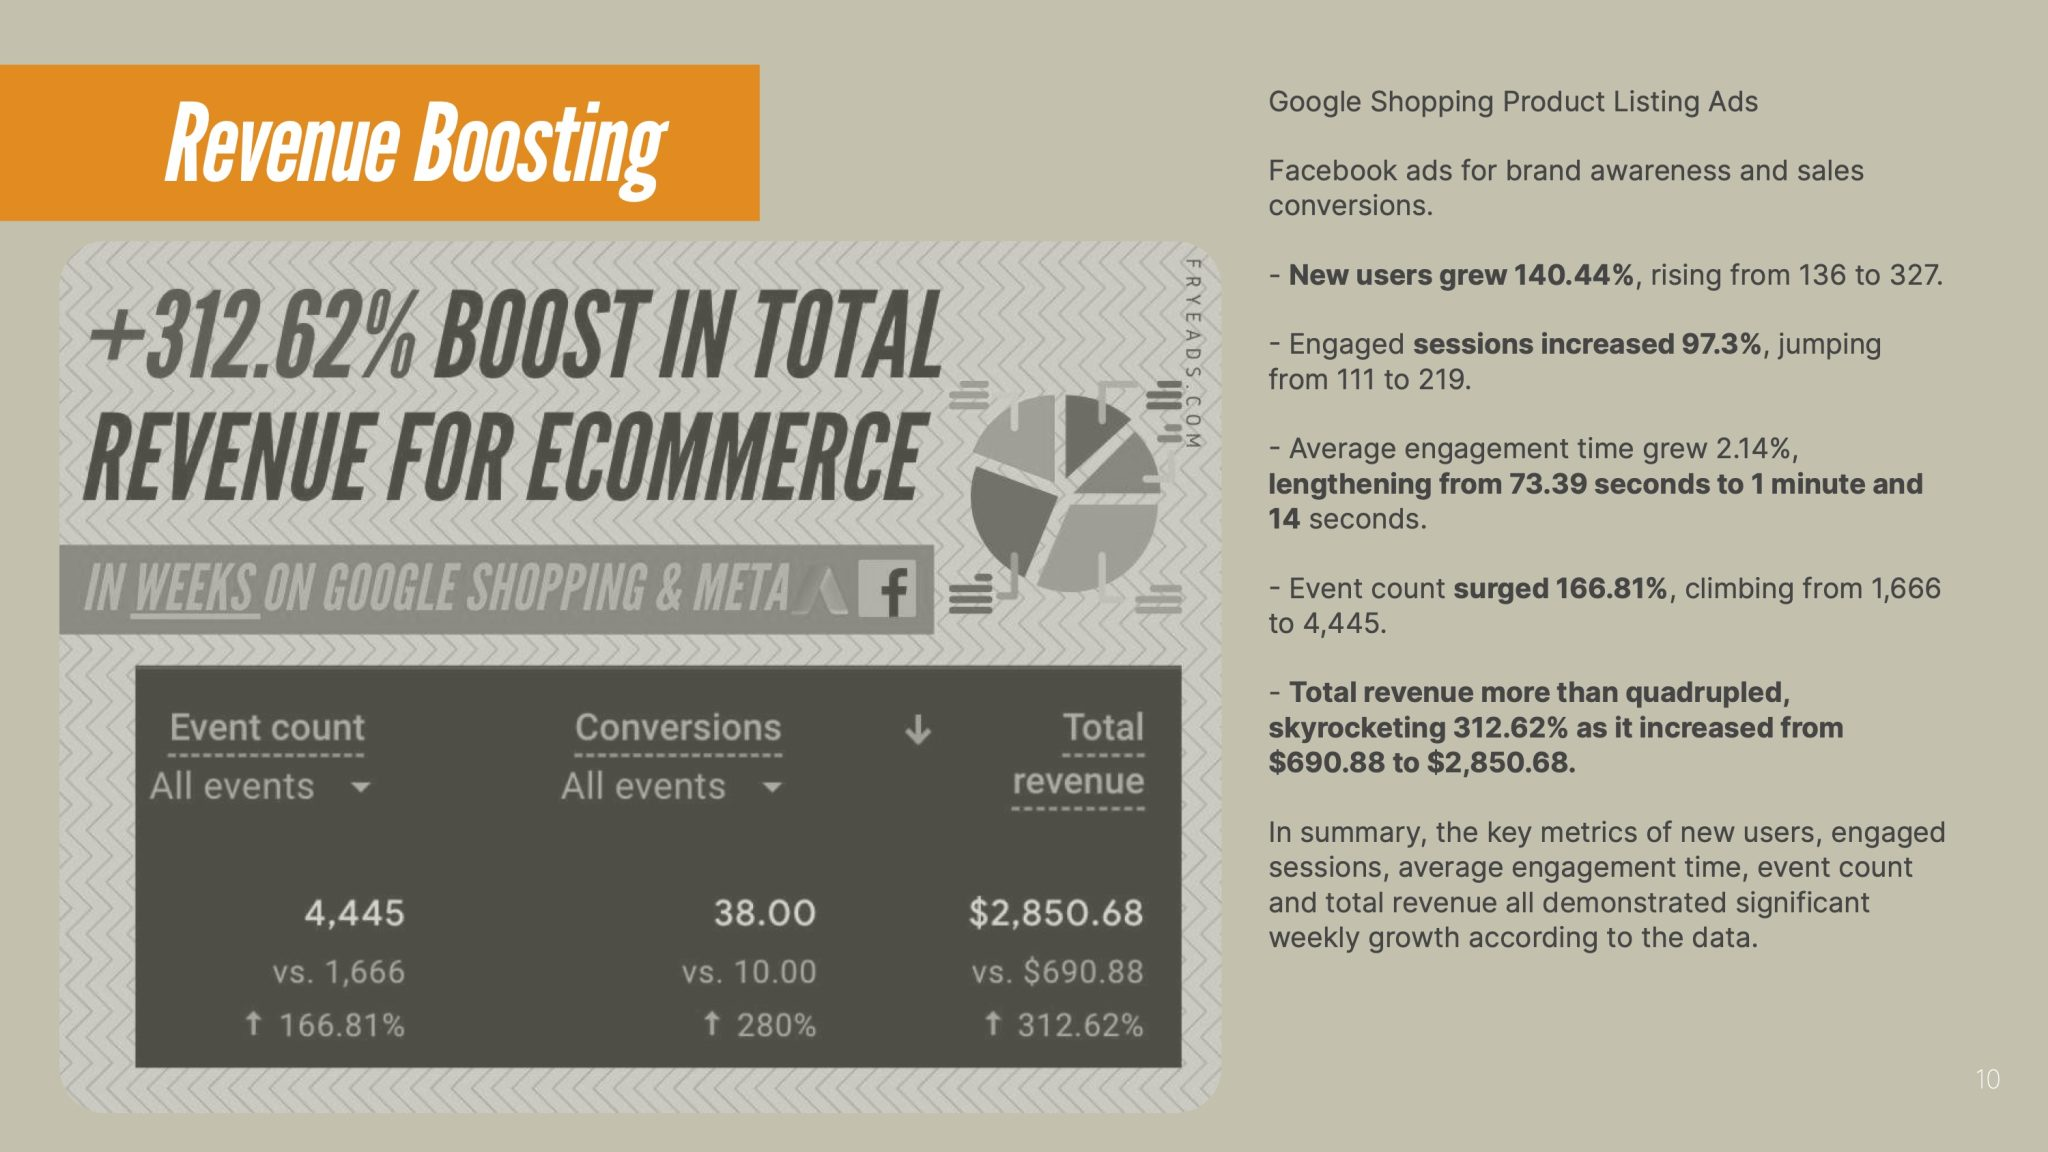
312.62% lift in total revenue
$690.88 → $2,850.68
A short paid-media sprint focused on shopping intent, social demand creation and conversion activity.
Total revenue+312.62%$690.88 → $2,850.68
Event count+166.81%1,666 → 4,445
Conversions+280%10 → 38
New users+140.44%136 → 327
Engaged sessions+97.3%111 → 219
Performance curve
Performance movement
$690.88→$2,850.68
Before
690.88
After
2,850.68
The line uses the reported before-and-after values only; it is a visual of the measured change, not an invented time series.
What changed
Revenue moved because the account was optimized beyond traffic volume. Google Shopping captured people already signaling purchase intent, while Meta expanded the pool of qualified demand. The reported lift was broad-based: revenue, events, conversions, new users and engaged sessions all increased in the same period.
How / why
Google Shopping captured existing purchase intent while Meta expanded reach beyond the existing customer pool.
The account was managed against downstream events and revenue, not clicks alone.
The result was a simultaneous lift in traffic quality, conversion volume and realized revenue.
02Lead Generation / Banking
Google Search
Outcome
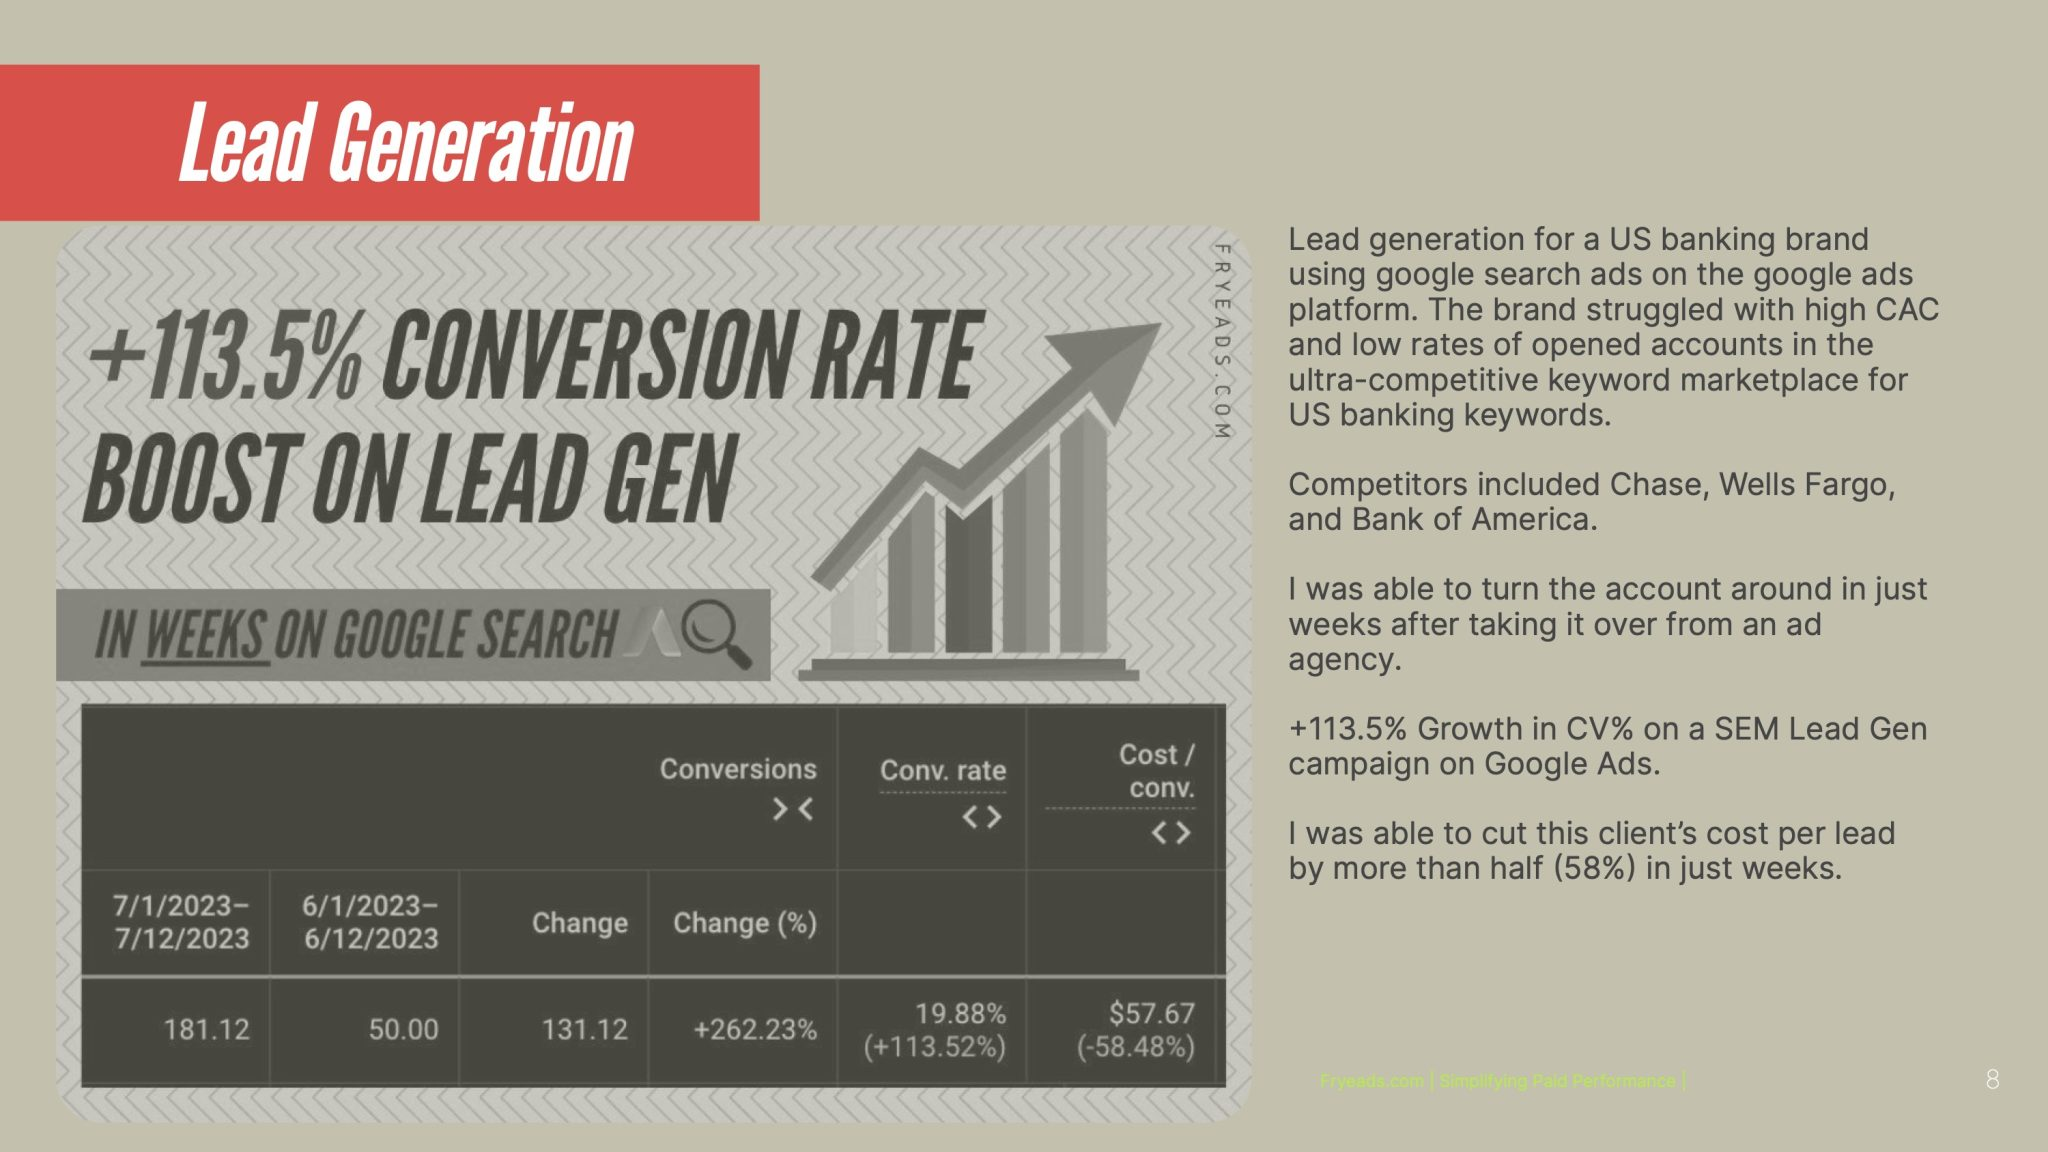
113.5% conversion-rate improvement
9.31% → 19.88% CVR
A US banking lead-generation account with high acquisition costs and pressure in a highly competitive search auction.
Conversion rate+113.52%9.31% → 19.88%
Conversions+262.23%50.00 → 181.12
Cost / conversion-58.48%$138.99 → $57.67
Performance curve
Performance movement
9.31%→19.88%
Before
9.31%
After
19.88%
The line uses the reported before-and-after values only; it is a visual of the measured change, not an invented time series.
What changed
The central change was efficiency. Search activity was narrowed toward stronger intent, then judged against conversion rate and cost per conversion rather than clicks alone. The reported conversion rate more than doubled while cost per conversion fell by 58.48%, creating more lead volume at a materially lower acquisition cost.
How / why
Search was tightened around higher-intent demand rather than treating all keyword traffic equally.
Budget and campaign decisions were tied to conversion efficiency and cost per lead.
The account produced more conversion volume while the reported cost per conversion fell by more than half.
03E-commerce / Paid Social
Facebook + Instagram
Outcome
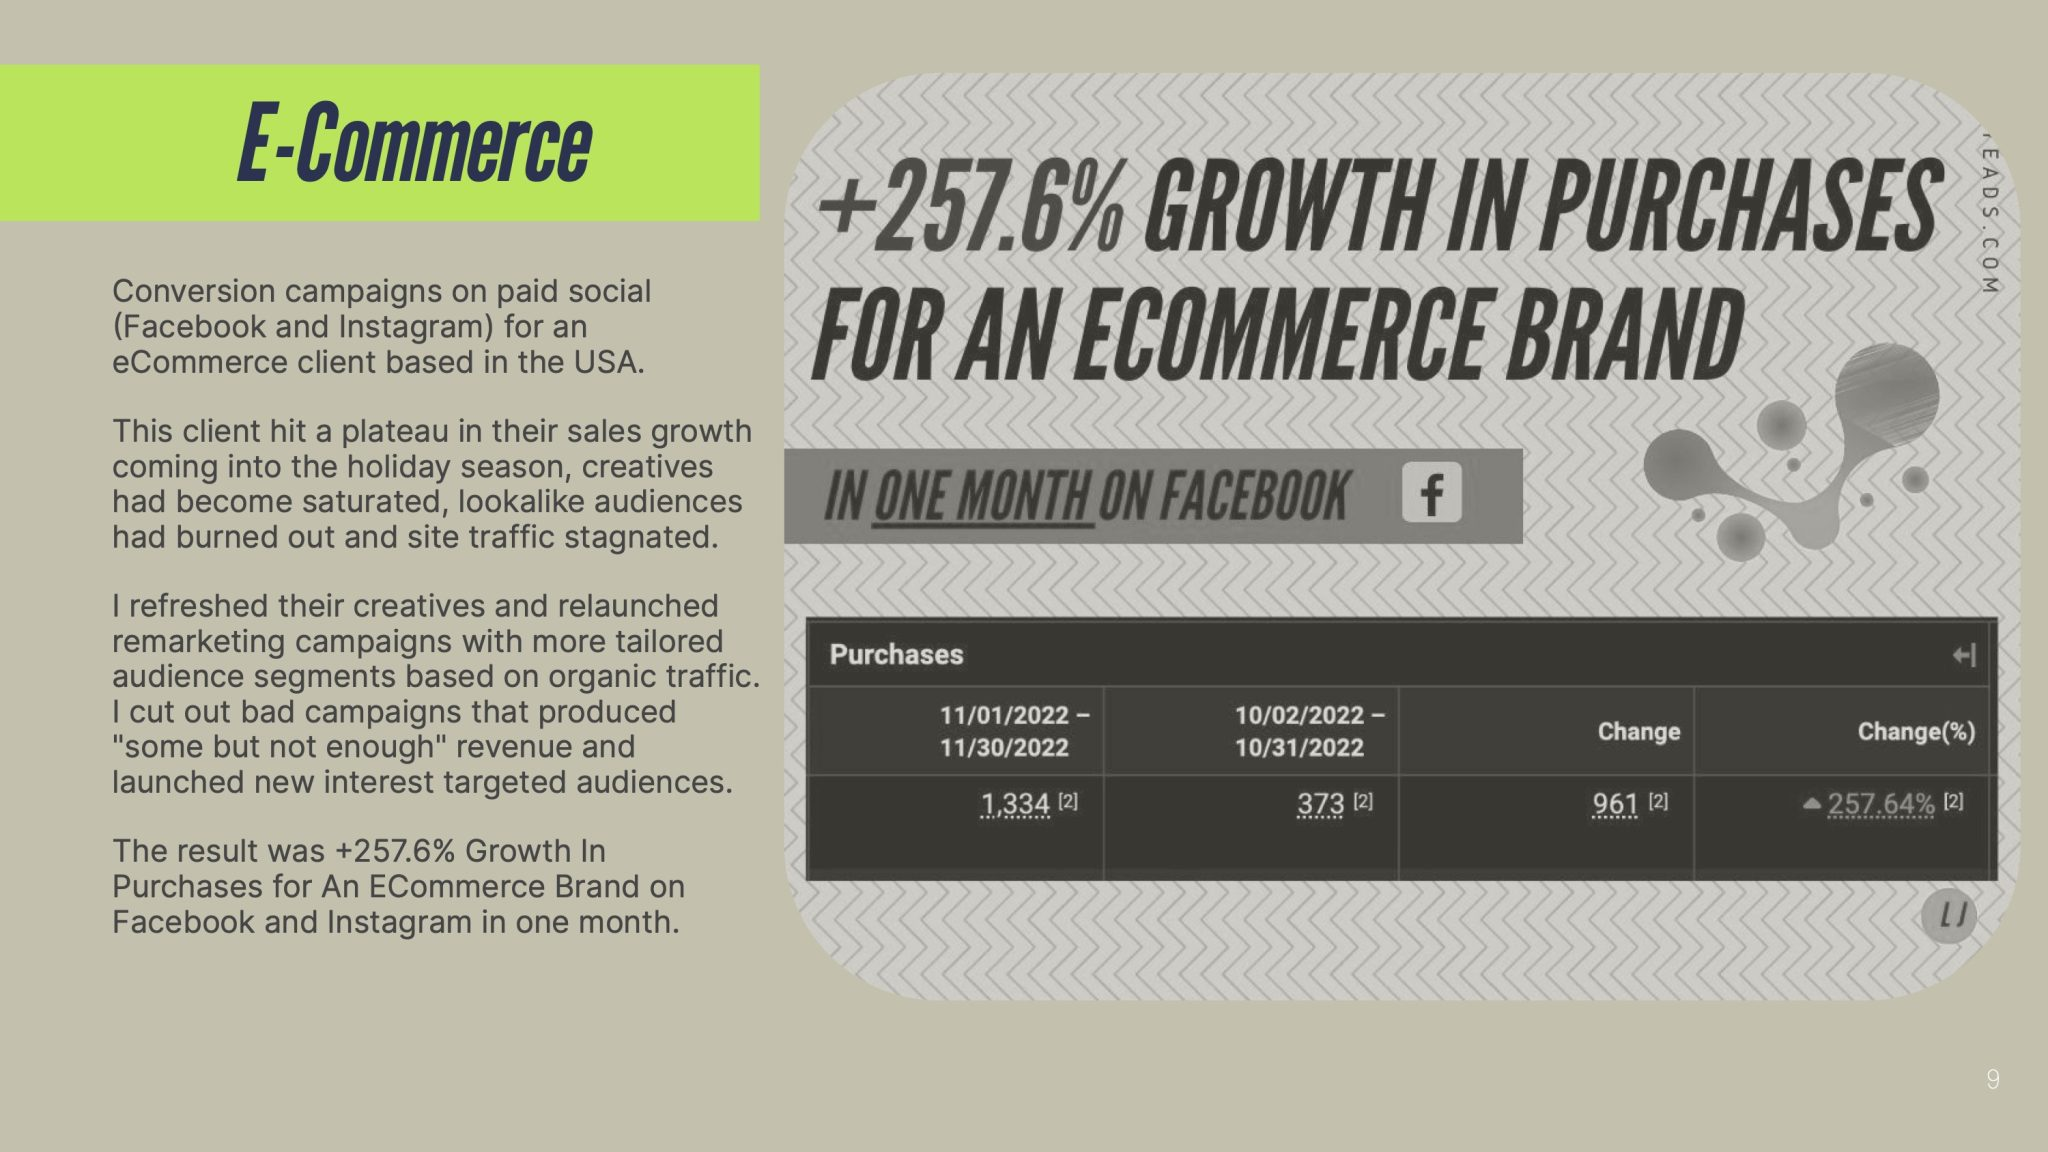
257.64% growth in purchases
373 → 1,334 purchases
An e-commerce brand had plateaued entering the holiday season, with creative saturation, audience fatigue and stagnant traffic.
Purchases+257.64%373 → 1,334
Incremental purchases+961— → 961
Performance curve
Performance movement
373→1,334
Before
373
After
1,334
The line uses the reported before-and-after values only; it is a visual of the measured change, not an invented time series.
What changed
The account had reached a creative and audience ceiling. Instead of pushing more spend into the same setup, the work refreshed creative, rebuilt remarketing around behavioral signals and removed campaigns that were producing weak incremental value. Purchases rose from 373 to 1,334 in one month, a reported increase of 257.64%.
How / why
Creative was refreshed instead of continuing to scale saturated ads.
Remarketing was rebuilt around more tailored audience segments based on organic-traffic behavior.
Underperforming campaigns were cut, while new interest-targeted audiences were launched.
Performance marketing
The point isn't more activity. It's measurable movement.